Volatility Indicator
This is a statistical measure of volatility called the coefficient of variation. It measures the standard deviation of closing price from its simple moving average.
Volatility is normally used to measure the risk profile of managed funds.
Example
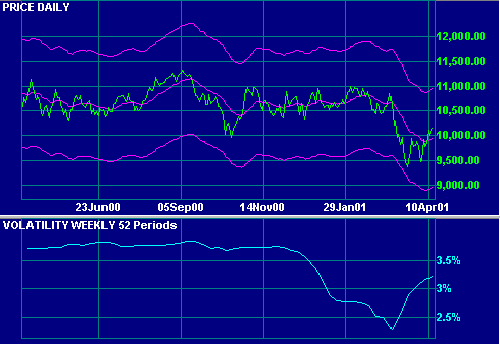
Dow Jones Industrial Average with 52 week Volatility.
Setup
The default period is 125 days. To alter the default settings - Edit Indicator Settings.
See Indicator Panel for directions on how to set up an indicator.
Volatility Indicator Formula
Volatility = standard deviation of closing price [for n periods] / average closing price [for n periods]
n periods is normally taken for 1 to 5 years.
Standard Deviation
For the more technically-minded, Standard Deviation is the basic statistical measure of the dispersion of a population of data observations around a mean. Referred to as STD (or by the Greek symbol sigma) it is the square root of the Variance.
To calculate the Variance:
- Measure the deviation of each data point from the Mean (the average of the entire population).
- Square the deviations.
- Sum the squared deviations.
- Divide the sum by the total number of observations.
STD is calculated as the square root of the Variance.

Author: Colin Twiggs is a former investment banker with almost 40 years of experience in financial markets. He co-founded Incredible Charts and writes the popular Trading Diary and Patient Investor newsletters.
Using a top-down approach, Colin identifies key macro trends in the global economy before evaluating selected opportunities using a combination of fundamental and technical analysis.
Focusing on interest rates and financial market liquidity as primary drivers of the economic cycle, he warned of the 2008/2009 and 2020 bear markets well ahead of actual events.
He founded PVT Capital (AFSL No. 546090) in May 2023, which offers investment strategy and advice to wholesale clients.