Volume Oscillator
The Volume Oscillator (VO) identifies trends in volume using a two moving average system.
The Volume Oscillator measures the difference between a faster and slower moving average (MA).
- If the fast MA is above the slow MA the oscillator will be positive.
- If the fast MA is below the slow MA then the oscillator will be negative.
- The Volume Oscillator will be zero when the two MA's cross.
Trading Signals
- Rising volume (positive VO) signals a strong trend.
- Falling volume (negative VO) indicates trend weakness.
Example
Coca Cola Corporation with Volume Oscillator.
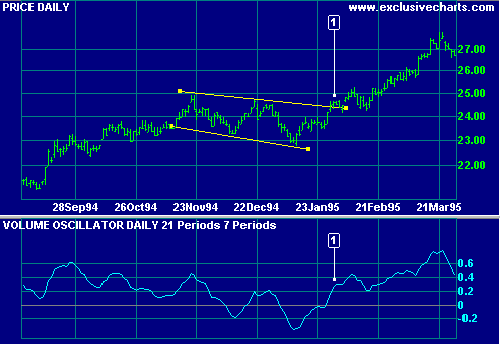
Mouse over chart captions to display trading signals.
Price forms a flag pattern after a strong up-trend. Volume declines on each trough and rises on each peak, suggesting an upward breakout.
- The breakout above the resistance line is then confirmed by a sharp rise in volume.
Setup
See Indicator Panel for directions. The default Volume Oscillator settings are:
- Fast MA - 5 days
- Slow MA - 10 days
- Exponential moving averages.
To alter the default settings - Edit Indicator Settings.

Author: Colin Twiggs is a former investment banker with almost 40 years of experience in financial markets. He co-founded Incredible Charts and writes the popular Trading Diary and Patient Investor newsletters.
Using a top-down approach, Colin identifies key macro trends in the global economy before evaluating selected opportunities using a combination of fundamental and technical analysis.
Focusing on interest rates and financial market liquidity as primary drivers of the economic cycle, he warned of the 2008/2009 and 2020 bear markets well ahead of actual events.
He founded PVT Capital (AFSL No. 546090) in May 2023, which offers investment strategy and advice to wholesale clients.