Williams Accumulation Distribution
Williams Accumulation Distribution is traded on divergences. When price makes a new high and the indicator fails to exceed its previous high, distribution is taking place. When price makes a new low and the WAD fails to make a new low, accumulation is occurring.
Williams Accumulation Distribution was created by Larry Williams.
Trading Signals
- Go long when there is a bullish divergence between Williams Accumulation Distribution and price.
- Go short on a bearish divergence.
Example
Commonwealth Bank of Australia (CBA) is plotted with Williams Accumulation Distribution.
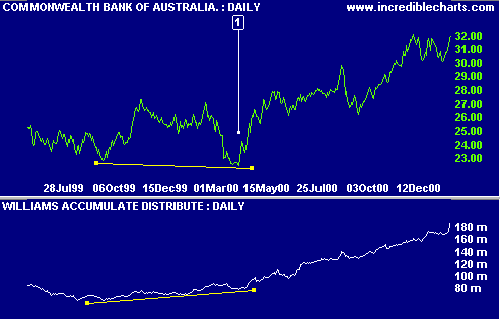
Mouse over chart captions to display trading signals.
- Go long [L] on a bullish divergence.
Setup
See Indicator Panel for directions on how to set up an indicator. Edit Indicator Settings to alter the default settings.
Formula
To calculate Williams Accumulation Distribution:
1. Calculate the True Range High and True Range Low:
True Range High is the greater of:
- High [today], and
- Closing price [yesterday]
True Range Low is the lesser of:
- Low [today]
- Closing price [yesterday]
2. Compare Closing price to yesterday's Closing price:
- If Close [today] is greater than Close [yesterday]
Price Move [today] = Close [today] - True Range Low - If Close [today] is less than Close [yesterday]
Price Move [today] = Close [today] - True Range High - If Close [today] equals Close [yesterday]
Price Move [today] = zero
3. Multiply the price move by volume:
AD [today] = Price Move [today] * Volume [today]
4. Calculate the cumulative total:
Williams AD = AD [today] + Williams AD [yesterday]
AUTHOR'S NOTE:
Steven Achelis omits step 3. above in his book Technical Analysis A-Z and several other websites/software programs appear to follow this approach. For the benefit of investors accustomed to Achelis' approach, we have provided both versions. Achelis' version is described as Williams Accumulate Distribute.

Author: Colin Twiggs is a former investment banker with almost 40 years of experience in financial markets. He co-founded Incredible Charts and writes the popular Trading Diary and Patient Investor newsletters.
Using a top-down approach, Colin identifies key macro trends in the global economy before evaluating selected opportunities using a combination of fundamental and technical analysis.
Focusing on interest rates and financial market liquidity as primary drivers of the economic cycle, he warned of the 2008/2009 and 2020 bear markets well ahead of actual events.
He founded PVT Capital (AFSL No. 546090) in May 2023, which offers investment strategy and advice to wholesale clients.