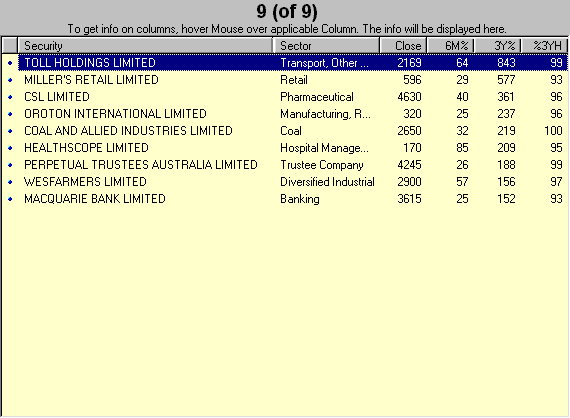
Stock Screen Return
The results of a Stock Screen Search are presented in spreadsheet format.
Example 1
Here is the results page for all securities on the Australian Stock Exchange (ASX) where:
- Closing price has increased by 20% or more over the last 6 months;
- Closing price has increased by 150% or more over the last 3 years; and
- Closing price is at least 90% of the highest price traded in the the last 3 years.
(The same criteria as used in Example 1 - Stock Screen Input).

Number of Securities
The number of securities returned on the page and the total number of securities that meet the search criteria are displayed at the top of the spreadsheet [e.g. 9 (of 9) ]. If not all securities are displayed [e.g. 100 (of 182) ] - amend the Results/Page setting on the Screen Input, or scroll through the return pages.
Edit Screen Input
To edit your screen, return to the Input page by Clicking
Stock Screen Filters or
![]() on the toolbar.
on the toolbar.
Scroll through Return pages
If not all securities that meet the search criteria are displayed on a single page, use the scroll arrows on the toolbar to navigate through the pages.
There are three scroll buttons:
- scroll forward
- return to original results page
- scroll back
Sort Securities
- Arrange the securities in order of any field on the spreadsheet - by clicking on the column header (e.g. Click on 6M% and the securities are sorted from highest to lowest 6M% move).
- Click on the column header again and the order is reversed (e.g. Click on 6M% a second time and the securities are sorted from lowest to highest 6M% move).
- To revert to the original spreadsheet order - click on the header above the first (bullets) column.
Select a Security
Click on a security to select it. It will remain highlighted until another is selected.
Chart a Security
To chart a security:
- Select the security
- Click
 on the toolbar.
Create a Watchlist
Select one of the following options:
- Add Selected Security To Watchlist

Select a security and then click to add it to a chosen watchlist. - Create Watchlist: Automatically adding Top 20 Securities
 [F7]
[F7]
A new watchlist is created with the top 20 securities on the stock screen list. - Create Watchlist: Automatically adding All Securities
 [F8]
[F8]
A new watchlist is created with all the securities on the stock screen list.

Author: Colin Twiggs is a former investment banker with almost 40 years of experience in financial markets. He co-founded Incredible Charts and writes the popular Trading Diary and Patient Investor newsletters.
Using a top-down approach, Colin identifies key macro trends in the global economy before evaluating selected opportunities using a combination of fundamental and technical analysis.
Focusing on interest rates and financial market liquidity as primary drivers of the economic cycle, he warned of the 2008/2009 and 2020 bear markets well ahead of actual events.
He founded PVT Capital (AFSL No. 546090) in May 2023, which offers investment strategy and advice to wholesale clients.
