Trading Trends with Twiggs Momentum & Keltner Channels
The objective of this system is to identify stocks with a high probability of forming a strong up-trend.
- 63-Day Twiggs Momentum (TMO) above a 42-day Wilder Moving Average identifies stocks with growing momentum.
- 63-Day Keltner Channels at a multiple of 2 times 42-day ATR is used to confirm momentum and to signal exits.
Trend-Following Rules
- Enter when Twiggs Momentum is above its MA (and above zero) and price closes above the upper Keltner Channel.
- Exit when price closes below the lower Keltner Channel.
Filters
If you take every TMO cross above its MA, you are likely to get a lot of whipsaws. Look for an extended period (e.g. at least two months) or a trough above the MA as shown in the example below.
Example
Cedar Woods Properties (CWP) on the ASX:
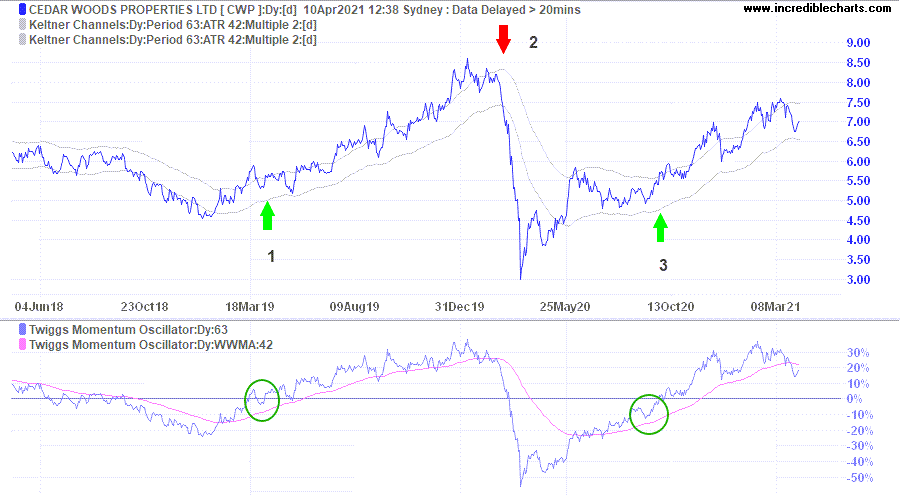
- Go long when Twiggs Momentum forms a trough above its MA (while TMO is above zero) and price closes above the upper Keltner Channel.
- Exit when price closes below the lower Keltner Channel.
- Go long again when Twiggs Momentum forms a trough above its MA and is above zero and price closes above the upper Keltner Channel.
Stock Screen
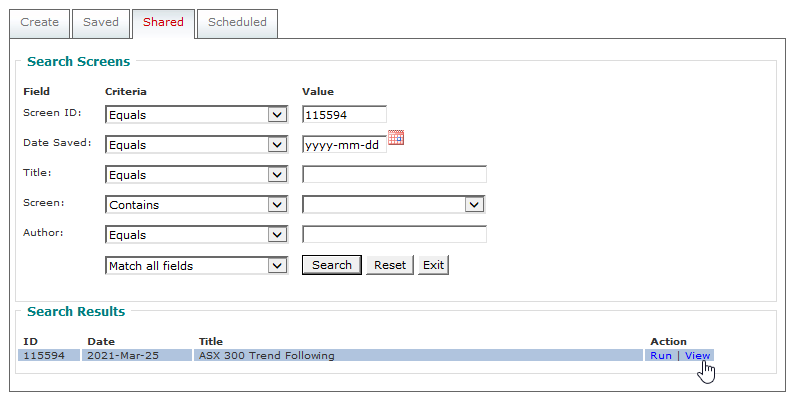
There is a saved screen on the stock screener. To access:
- Open the Stock Screener (Securities >> Stock Screens on the chart menu)
- Select the Shared tab
- Enter "115594" as the Screen ID and select Search
- Select Run next to the result, or View if you want to save or modify the settings.
Indicator Setup
- Select Indicators on the chart menu.
- Select each of the indicators in the left panel and insert the settings:
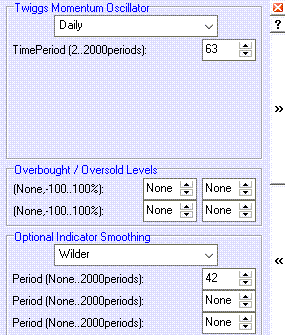
- Twiggs Momentum, 63-day with 42-day Wilder MA.
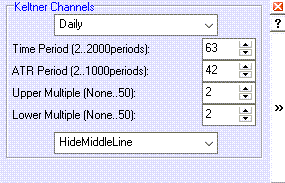
- Keltner Channels, 63-day at a multiple of 2 times 42-period ATR.
- Save the settings for each indicator using the >> button.
- Close the Indicator Panel (X).

Author: Colin Twiggs is a former investment banker with almost 40 years of experience in financial markets. He co-founded Incredible Charts and writes the popular Trading Diary and Patient Investor newsletters.
Using a top-down approach, Colin identifies key macro trends in the global economy before evaluating selected opportunities using a combination of fundamental and technical analysis.
Focusing on interest rates and financial market liquidity as primary drivers of the economic cycle, he warned of the 2008/2009 and 2020 bear markets well ahead of actual events.
He founded PVT Capital (AFSL No. 546090) in May 2023, which offers investment strategy and advice to wholesale clients.