Bollinger %b Indicator
Bollinger %b is described by John Bollinger on his website. It indicates the position of Closing Price relative to Bollinger Bands® plotted at 2 standard deviations around a 20-Day simple moving average.
Bollinger %b Trading Signals
Bollinger %b can be used in a trending or ranging market.
Trending Market
- Go long if a retracement records a negative number on %b (i.e. price has closed below the lower Bollinger Band) and is followed by a second retracement where %b remains positive.
- Go short if a rally records a value above 100 for %b (the upper Bollinger Band) and is followed by a second rally where %b remains below 100.
Use failure swings on Welles Wilder's Relative Strength Index to confirm the signals.
Example
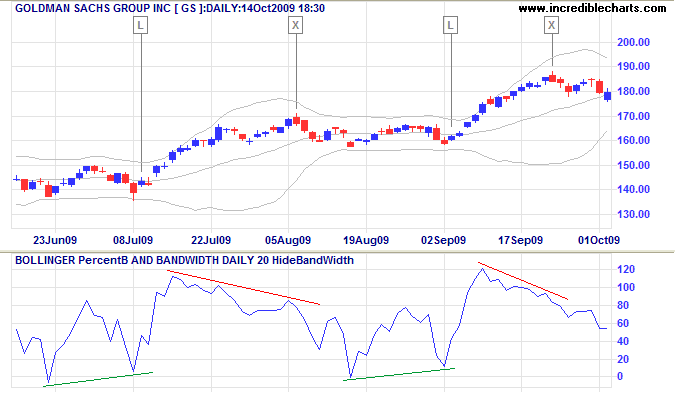
Goldman Sachs is displayed with 20-day Bollinger %b.

Mouse over chart captions to display trading signals.
- Go long [L] when a retracement on Bollinger %b respects the zero line after the previous retracement was below zero.
- Exit [X] when a rally on Bollinger %b falls short of 100 after the previous rally exceeded 100.
- Go long [L] when the retracement on Bollinger %b reverses while above zero after the previous retracement reached zero.
- Exit [X] after another bearish divergence on Bollinger %b, from above to below 100.
Setup
The default setting for Bollinger %b is a 20-Day simple moving average with bands drawn at 2 standard deviations.
See Indicator Panel for directions on how to set up an indicator — and Edit Indicator Settings to change the settings.
Bollinger %b Formula
Bollinger %b = (Closing Price - Lower Band) / (Upper Band - Lower Band).

Author: Colin Twiggs is a former investment banker with almost 40 years of experience in financial markets. He co-founded Incredible Charts and writes the popular Trading Diary and Patient Investor newsletters.
Using a top-down approach, Colin identifies key macro trends in the global economy before evaluating selected opportunities using a combination of fundamental and technical analysis.
Focusing on interest rates and financial market liquidity as primary drivers of the economic cycle, he warned of the 2008/2009 and 2020 bear markets well ahead of actual events.
He founded PVT Capital (AFSL No. 546090) in May 2023, which offers investment strategy and advice to wholesale clients.
