Trading Trends with Twiggs Momentum & Trend Index
Addressing weaknesses in momentum trading strategies.
Our latest trend trading system uses the Twiggs Trend Index to help identify established up-trends.
The Momentum Effect
Momentum is simply the rate of change in a stock price over time.
The momentum effect is a widely researched and accepted anomaly in academic circles, where stocks with strong momentum have the highest probability of outperforming in the next period.
Contrary to the efficient market hypothesis, performance is not random, but tends to occur in clusters.
Trend versus Momentum
What is the difference between momentum and a trend? The latter is simply a sub-group. Momentum stocks exhibit a steep rate of change over a set time period. A trend is where a stock experiences above-average rate of change over a longer time frame, displaying consistent momentum.
Profits from momentum trading strategies are normally derived from trending stocks that post sizable gains over longer time frames.
Momentum Trading
The simplest momentum indicator is Rate of Change, which calculates the change in price over a selected time period, measured as a percentage of the price at the start of the period.
We prefer our proprietary Twiggs Momentum because it minimizes base effects from unusual price moves in earlier periods. We scan for Twiggs Momentum, say 50 periods, and select stocks above a specific performance threshold, such as 30%.
The power of momentum is its proven reliability. The downside is its volatility. Momentum delivers stellar results in a bull market, but is susceptible to steep losses when the market turns bearish.
Also, like most trend trading strategies, momentum typically exhibits a low win rate. The strategy relies on large gains in around 20% to 30% of stocks to cover any losses incurred in the remainder.
Indicators
Our strategy uses two main indicators: Twiggs Momentum and Twiggs Trend Index.
The Trend Index is used to distinguish between a brief momentum spike and one demonstrating long-term accumulation by buyers. It is also useful for highlighting growing distribution in an established up-trend.
Twiggs Momentum
Momentum indicators like Rate of Change (ROC) and Momentum typically suffer from base effects. If we take 10-day ROC as an example, a sharp fall on Day 1 will cause ROC to jump on Day 11, when the first day is dropped from the calculation.
We developed Twiggs Momentum to address this weakness, smoothing the momentum signal without introducing a lag typically encountered with moving average systems.
Smoothed Version
We also developed a smoothed version with a focus on identifying longer term trend movements rather than shorter, more erratic fluctuations.
Twiggs Trend Index
Our second proprietary indicator, Twiggs Trend Index, measures market sentiment, reflecting the willingness of buyers or sellers to move prices higher or lower respectively. High values signal strong accumulation, while negative values indicate distribution.
While accumulation and distribution typically move with momentum, there are times where the Trend Index rises ahead of momentum. This indicates where buyers are accumulating stock in a base or consolidation, and normally occurs in the weeks or months before a breakout.
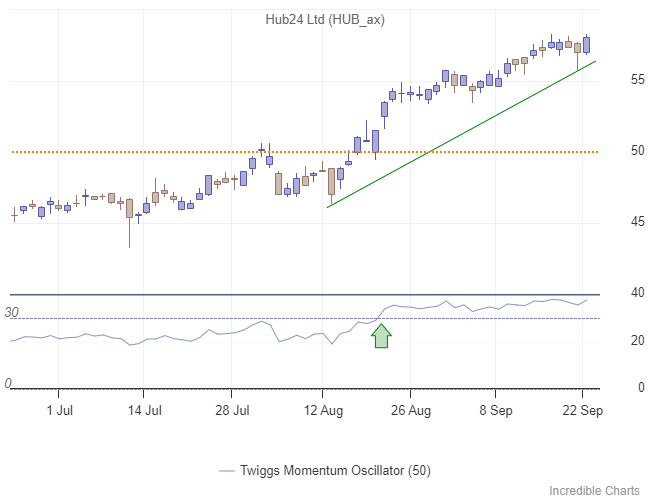
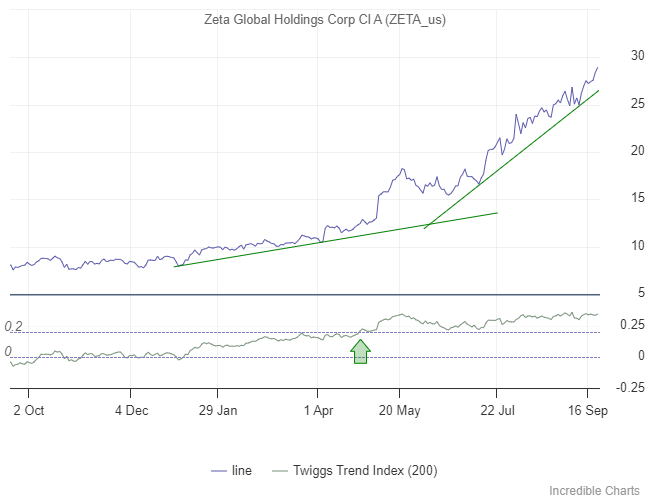
Some of the stocks identified are already in established up-trends when they cross to above 0.2 on the Trend Index. These normally offer the best probability of trend continuation:
Indicator Setup
Twiggs Momentum Smoothed: 50-Day, signal level at 10
Twiggs Trend Index: 100-Day, signal level at 0.2
Twiggs ATR Trailing Stop: 10-day MA, 10-day ATR, 3xATR Upper, 5xATR Lower
Trading Strategy
Objective
Capture gains from small-cap and mid-cap stocks with established trends.
Entry
Go long when:
- Twiggs Trend Index is > 0.3; and
- Twiggs Momentum > 40.
Exit
Exit the trade if:
- price falls more than 10% from the entry price; or
- price closes below the ATR Trailing Stop.
Position Size
Divide your capital into 15 or 20 positions of equal size. It is useful to keep each as a round number (e.g. $10,000 or $20,000). That makes it easier to monitor percentage gain or loss on each stock.
Stock Selection
Rank stocks according to Twiggs Momentum values and select the highest.
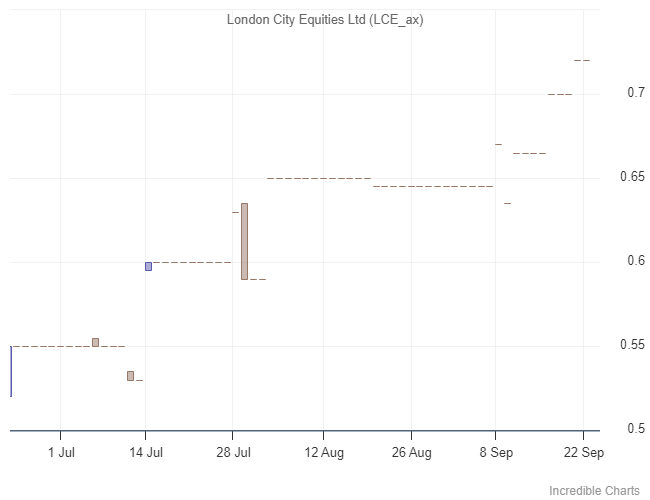
Visually inspect each chart for anomalies.
This just screams “poor liquidity”:
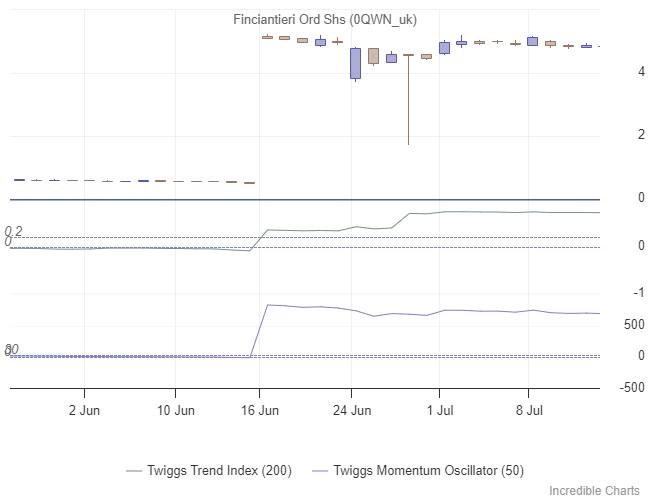
Base effects from a weak price history:
Re-ranking
Review existing stock holdings at the end of each quarter.
Rank stocks according to Twiggs Smoothed Momentum, replacing existing stocks if:
- Twiggs Trend Index < 0.2; or
- Twiggs Momentum Smoothed < 10; and
Replace with the highest ranked stock that meets our entry criteria.
Bull/Bear Market
Sell 50% of positions if the Bull-Bear market weekly snapshot falls to 60%.
Sell the remaining 50% if it falls to 40%.
Commit 50% of capital if the Bull-Bear market indicator rises to 60%.
Commit the remaining 50% on a rise to 80%.
Observations
Profit-Taking
Don’t.
We had considered selling one-third when a stock shows 200% profit, to recoup our initial outlay, but it doesn’t make sense to reduce exposure to a top-performing stock.
Pyramiding
Only pyramid, increasing your holding of a stock, if there is no suitable alternative available from the stock screen.
Trailing Stops
The trend needs room to breathe and our lower ATR Trailing Stop is set wide to keep us in the trend as long as possible. Whipsaws occur more frequently and are far more expensive than a late exit.
Stock Screen Setup
Twiggs Momentum Smoothed: 50-Day, minimum 10
Twiggs Trend Index: 100-Day, minimum 0.2
Twiggs Momentum: 100-Day, minimum 0
RSI: 50-Day, minimum 50
Price Filter: Minimum 0.10, Maximum 100
(We find small caps below 10 cents on the ASX to be too volatile. Filters will also need to be adjusted higher if trading say the LSE, TSX, NYSE or NASDAQ)
Price High: 2-Year New High within the last 50 periods
Value (Price x Volume): Minimum 2-day moving average value of $1,000,000
Sectors: We prefer to limit the search to Energy, Technology, Financials, and Metals & Mining on the ASX but that is optional and may be expanded on other exchanges.
Conclusion
This momentum trading strategy is designed to capture established trends in small-cap and mid-cap stocks on major exchanges like the ASX, LSE, NASDAQ, NYSE, and TSX. The objective is to minimize whipsaws, avoiding volatile new breakouts in exchange for slower but more reliable, established trends.

Author: Colin Twiggs is a former investment banker with almost 40 years of experience in financial markets. He co-founded Incredible Charts and writes the popular Trading Diary and Patient Investor newsletters.
Using a top-down approach, Colin identifies key macro trends in the global economy before evaluating selected opportunities using a combination of fundamental and technical analysis.
Focusing on interest rates and financial market liquidity as primary drivers of the economic cycle, he warned of the 2008/2009 and 2020 bear markets well ahead of actual events.
He founded PVT Capital (AFSL No. 546090) in May 2023, which offers investment strategy and advice to wholesale clients.