Getting Started: Indicators & Overlays
Add an Indicator
- Select Indicators on the main menu to open the Indicator Panel.
- Select an indicator from the left column
- Adjust the settings in the center if necessary
- Save the indicator
 . It will appear in the right column
 - Click
 to close the Indicator Panel
Compare Stocks
To compare two stocks or indexes:

- Select Price Comparison (Intercept) in the left column of the indicator panel.
- Select a stock or index from the pop-up menu (e.g. $DJI).
- Leave the intercept date blank unless you want the comparison to start from a specific date.
- Change Security to Project if you want the comparison to display for all stocks in a project.
- Save the indicator
 and close the panel.
Change the Screen View
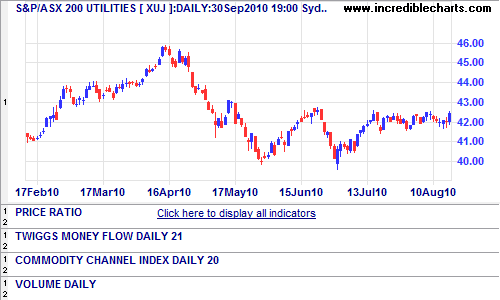
When you add more than 3 indicators they may appear blank because they are too small to display meaningful information.

Click ![]() in the left margin for a full screen view of a chart or indicator.
in the left margin for a full screen view of a chart or indicator.
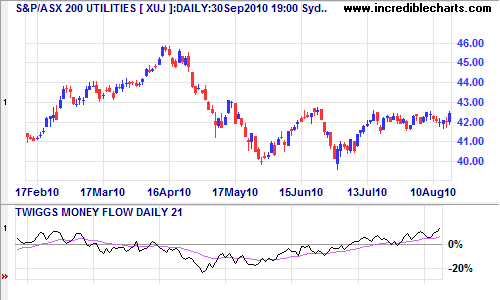
Click ![]() to display a split screen view of an indicator and the price chart.
to display a split screen view of an indicator and the price chart.

Click ![]() to return to the default view with all indicators.
to return to the default view with all indicators.
