Technical Indicators: a Trading Guide
What are Technical Indicators?
Technical indicators highlight a particular aspect of price or volume behavior on a stock chart, offering valuable insights to enhance analysis. Precise entry & exit signals help to reduce psychological pressure while stock trading. Stock screens also save time in identifying suitable opportunities to trade.
How To Use Technical Indicators
Newcomers often attach mystical significance to their favorite indicators, but none are infallible. It pays to use two or three to confirm each other. But make sure that they are fairly independent and don't always mimic each other.
Six Simple Rules
Some rules for trading with indicators:
1. Keep It Simple
Select a small number of indicators — two or three — and use them to confirm signals from each other.
2. Use Contrasting Indicators
Select indicators that complement each other and are not based on the same data. For example, three indicators based on closing price will tend to confirm each other; while indicators based respectively on closing price, volume and trading range will more often conflict and are therefore more reliable when they do confirm each other.
3. Master Your Tools
Study each indicator's behavior until you know them well. Technical indicators are like a carpenter's tools: skilled use can produce excellent results but unskilled use may risk injury.
4. Trending & Ranging Markets
Identify whether you are in a trending or ranging market. No one indicator is suited to all market conditions. Trend indicators lose money during a ranging market as traders are whipsawed in and out of positions. Momentum oscillators give unprofitable early exit signals in trending markets.
5. The Trend Is Your Friend
Only trade in the direction of the trend. Use a trend indicator, such as a moving average, in a longer time frame than the cycle being traded to indicate trend direction. For example, if trading the secondary cycle, use a 100-day or 200-day weighted or exponential moving average to determine primary trend direction.
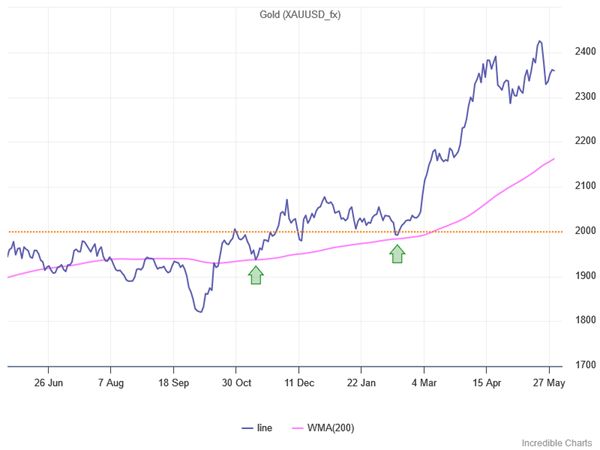
Example: Gold with 200-day Weighted Moving Average
The chart below shows Gold's strong trend in the last 3 months, preceded by respect of the 200-day Weighted Moving Average at the green arrows.
6. Use the Price Chart
Where possible, base your final decision on the price chart.
What Types of Indicators to Use
There are several types of indicators, each designed for a specific purpose:
Momentum Indicators
Momentum oscillators can be used for two purposes:
- To track short-term oscillations when trading ranging markets; and
- Longer-term Momentum indicators can be used to gauge trend strength in a trend-following system.
Construction methods generally compare current price to earlier prices but there are a number of variations using:
- Closing price
- Moving average (of closing price)
- Highest or lowest price
- Range (high minus low)
- True Range or Average True Range
- Absolute Price Movement
Favorite Momentum Indicators
Our favorites are the Twiggs® Momentum Oscillator and Welles Wilder's Relative Strength Index (RSI) which offer the following advantages:
- Minimal distortion from market noise;
- No base effects; and
- Consistent overbought and oversold signals at set levels.
For a detailed list and discussion of individual strengths and weaknesses, see Momentum Indicators.
Trend Indicators
Trend indicators, as the name implies, indicate trend direction.
Construction normally involves some form of smoothing which introduces a lag in responsiveness to trend changes.
Favorite Trend Indicators
Our favorites are the Weighted Moving Average (WMA), Gerald Appel's MACD and Welles Wilder's Directional Movement Index (DMI):
- WMA shows less distortion from short-term market noise and longer-term base effects.
- DMI is also not distorted by base effects and is less prone to whipsaws.
- MACD minimizes distortion from base effects and is not prone to whipsaws but tends to display greater lag.
See Trend Indicators for a complete list.
Volatility Indicators
Volatility indicators are great for flagging unusual price behavior. Our favorites are Jack Schwager's Volatility Ratio and our own Twiggs® Volatility. The former is highly responsive to daily or hourly market moves, while the latter is used as an alternative to VIX for tracking market indexes like the S&P 500.
Construction normally uses True Range or Average True Range, from Welles Wilder, or measures statistical deviation of price from a moving average.
See Volatility Indicators for further details.
Volume Indicators
Volume indicators are used to confirm the strength of support, resistance, breakouts and other stock chart signals.
We prefer to use plain volume bars, highlighting unusual activity with different colored bars for volume above 1.5 standard deviations, or below 1.0 standard deviations, against a 21-day exponential moving average of volume — at Volume Twiggs Standard Deviation.
See Volume Indicators for a full list.
Money Flow Indicators
Money Flow indicators measure buyer and seller sentiment.
Colin Twiggs has done extensive work in this area, developing the popular Twiggs® Money Flow indicator. More recently, he developed the Twiggs® Trend Index which uses volatility rather than volume to indicate market sentiment. This avoids the distortions that can be caused by large volume off-market (mainly institutional) transactions.
Price Target Indicators
Price Target indicators are useful in setting entry and exit points.
Fibonacci Retracements & Extensions are by far the most popular for longer-term swings, while Pivot Points are more suited for intra-day trading.
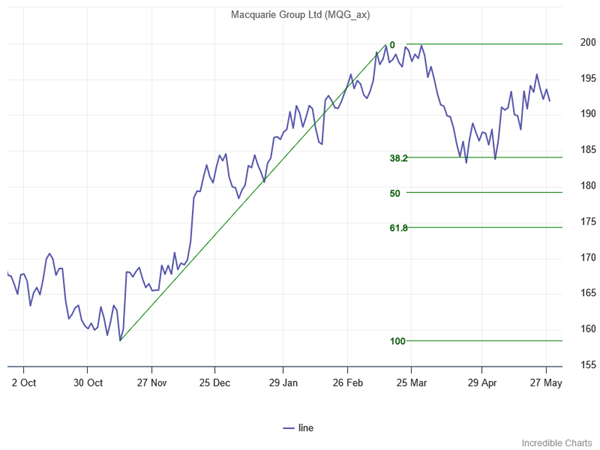
Example: Macquarie Group (MQG) with Fibonacci Retracement
The chart below shows Macquarie Group (MQG) with a bullish correction that respects support at the first Fibonacci retracement level of 38.2%.
Stop Loss Indicators
Stop Loss Indicators are designed to lock in profits and protect capital.
Average True Range (ATR) Trailing Stops are the most popular but we combine this with Percentage Trailing Stops for fast-trending stocks. Average True Range can sometimes be distorted by wide-ranging days and the Percentage Trailing Stop is used as a backstop.
What Time Frames to Use
Adjust indicator time frames to reflect the cycle being studied.
Alexander Elder, in Trading for a Living, offers useful advice for when in doubt:
- With trend indicators, make the window period longer;
- With oscillators, make the period shorter.
The same general rule applies to both moving averages and oscillators.
Moving Average Time Frames
Use moving averages (MA's) that are half the length of the cycle:
- 200 Day (40 Week) Moving Averages are popular for tracking longer cycles;
- 20 to 65 Day ( 4 to 13 Weeks) Moving Averages are useful for intermediate cycles; and
- 5 to 20 Days for short cycles.
Momentum Indicator Time Frames
Momentum oscillators also use windows that are half the length of the cycle.
Martin Pring in Technical Analysis Explained stresses the importance of using several windows with momentum indicators, in order to highlight patterns occurring in different time frames. He offers the following guidelines:
- Primary trend: 12 (recommended), 18 or 24 months;
- Intermediate cycle: 3, 6 or 9 months (13, 26 or 39 weeks); and
- Short cycle: 10 to 30 days.
Cycles often vary in length, so regularly check that the window that you are using is still appropriate.
Welles Wilder & Twiggs® Indicators
With indicators from J. Welles Wilder and Colin Twiggs — Relative Strength Index, Directional Movement, Twiggs® Money Flow and Twiggs® Momentum being the most well known — we recommend using a shorter time frame.
Example
If you are tracking a 30-day cycle you would normally select a 15-day indicator time period. With the RSI, for example, adjust the time period as follows:
RSI time period = (n + 1) / 2 = (15 + 1) / 2 = 8 days
Curve Fitting
Try to avoid finding the perfect indicator time frame to match past data history. Future data is unlikely to repeat the past.
We try to keep things simple by sticking to the following time frames:
- Short-term: 5 or 10 periods (1 or 2 weeks of daily bars);
- Medium-term: 20,21 or 50 (4 to 10 weeks)
- Long-term: 100, 200 or 250 (20 to 50 weeks)
Conclusion
Technical indicators are valuable tools that can save time and enhance decision-making. Some basic rules: keep it simple; select indicators that complement each other and are not based on the same data; and get to know them well. Our favorite indicators are:- Momentum: Twiggs® Momentum and Relative Strength Index (RSI)
- Trend:Weighted Moving Average (WMA), MACD and Directional Movement Index (DMI)
- Volatility:Volatility Ratio and Twiggs® Volatility
- Volume: Volume with Standard Deviation
- Money Flow: Twiggs® Money Flow and Twiggs® Trend Index
- Price Targets: Fibonacci Retracements & Extensions and Pivot Points
- Stop Loss Indicators: Average True Range (ATR) Trailing Stops and Percentage Trailing Stops
There is a complete list of indicators at Technical Indicators A~Z.
See also How to Trade Divergences and other Important Indicator Signals.

Author: Colin Twiggs is a former investment banker with almost 40 years of experience in financial markets. He co-founded Incredible Charts and writes the popular Trading Diary and Patient Investor newsletters.
Using a top-down approach, Colin identifies key macro trends in the global economy before evaluating selected opportunities using a combination of fundamental and technical analysis.
Focusing on interest rates and financial market liquidity as primary drivers of the economic cycle, he warned of the 2008/2009 and 2020 bear markets well ahead of actual events.
He founded PVT Capital (AFSL No. 546090) in May 2023, which offers investment strategy and advice to wholesale clients.