Average Directional Index (ADX)
ADX is part of the Directional Movement System developed by J. Welles Wilder but can be successfully used on its own to signal trend changes and to indicate whether a stock is trending or ranging.
ADX Signals
Trend Changes
A weakening trend is signaled when 14-day ADX turns down while above 40. Note that ADX only indicates trend strength — not trend direction. It may be wise to supplement ADX with a trend filter, whether directional movement or a moving average, to signal direction.
Trending or Ranging Markets
- ADX below 20 for any length of time indicates a ranging market;
- ADX rising above 20 indicates the start of a new trend;
- The trend signal is strengthened if ADX breakout is followed by a failed swing;
- ADX above 40 indicates a steep trend, but often precedes a reversal.
Example
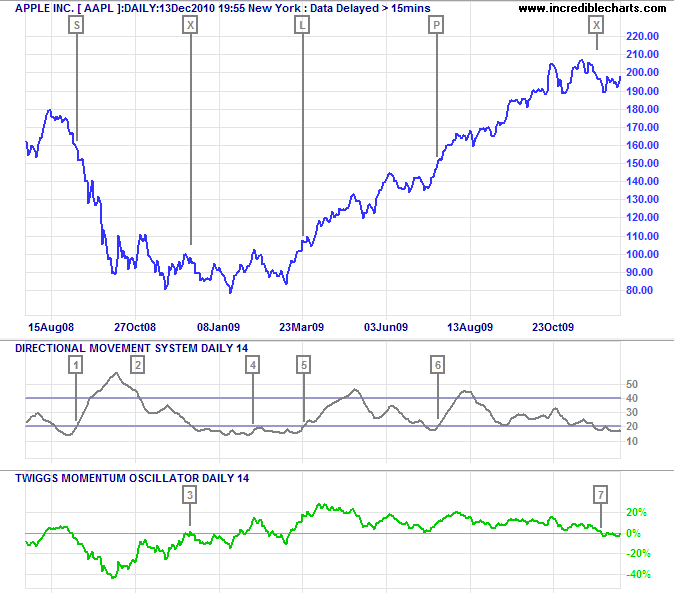
Apple Inc. [AAPL] is displayed with Average Directional Index (14 days) and 14-day Twiggs Momentum as a trend filter.

Mouse over chart captions to display trading signals.
- Go short when ADX rises above 20 and Momentum is below zero.
- ADX down-turn above 40 warns that the trend is weakening.
- Exit when Momentum crosses above zero.
- ADX holding below 20 indicates a ranging market.
- Go long when ADX rises above 20 and Momentum is above zero.
- Increase position when ADX recovers above 20 and Momentum still above zero.
- Exit when Momentum crosses below zero.
Setup
The default ADX period is set at 14 days.
See Indicator Panel for directions on how to set up an indicator — and Edit Indicator Settings to change the settings.
ADX Formula
See the Directional Movement Formula for details as to how ADX is calculated.

Author: Colin Twiggs is a former investment banker with almost 40 years of experience in financial markets. He co-founded Incredible Charts and writes the popular Trading Diary and Patient Investor newsletters.
Using a top-down approach, Colin identifies key macro trends in the global economy before evaluating selected opportunities using a combination of fundamental and technical analysis.
Focusing on interest rates and financial market liquidity as primary drivers of the economic cycle, he warned of the 2008/2009 and 2020 bear markets well ahead of actual events.
He founded PVT Capital (AFSL No. 546090) in May 2023, which offers investment strategy and advice to wholesale clients.
