Commodity Channel Index (CCI)
The Commodity Channel Index measures the position of price in relation to its moving average. This can be used to highlight when the market is overbought/oversold or to signal when a trend is weakening. The indicator is similar in concept to Bollinger Bands but is presented as an indicator line rather than as overbought/oversold levels.
The Commodity Channel Index was developed by Donald Lambert and is outlined in his book Commodities Channel Index: Tools for Trading Cyclic Trends.
CCI Trading Signals
Commodity Channel Index is best used in conjunction with trailing buy- and sell-stops.
Ranging Market
- Go long if the CCI turns up from below -100.
- Go short if the CCI turns down from above 100.
Trending Market
Divergences are stronger signals that occur less frequently. They are mostly used to trade intermediate cycles.
- Go long on a bullish divergence.
- Go short on a bearish divergence.
Example
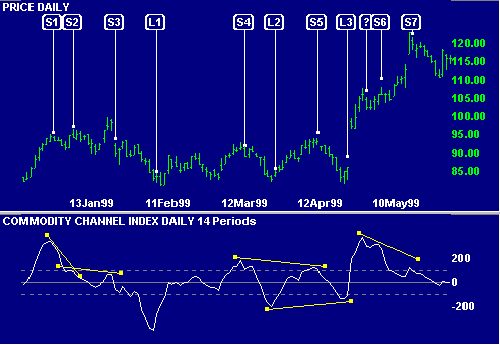
IBM Corporation with 14 day Commodity Channel Index. The days shown are the signal days. Trades are entered using trailing buy- and sell-stops on the day following.

Mouse-over chart captions to display trading signals.
Chart Captions
S1: Go short - Commodity Channel Index turns down above the overbought line.
This trade is stopped out at the rally before S2.
S2: Go short - bearish divergence. This trade is stopped out during the
rally before S3.
S3: Go short - bearish triple divergence.
L1: Go long - Commodity Channel Index turns up from below the oversold line.
The next day closes below the low of the signal day, causing the trade to be
stopped out. A trailing buy-stop would stop us back in two days later.
S4: Go short - Commodity Channel Index turns down above the overbought line.
L2: Go long - Commodity Channel Index turns up from below the oversold line.
S5: Go short - Commodity Channel Index turns down above the overbought line
and bearish divergence occurs.
L3: Go long - Commodity Channel Index turns up from below the oversold line
and bullish divergence occurs.
?: The market is now trending (evidenced by the break above the previous high).
Do not go short when Commodity Channel Index turns down above the overbought
line - wait for a bearish divergence.
S6: Go short - bearish divergence.
S7: Even stronger signal - bearish triple divergence.
Setup
The default Commodity Channel Index is set at 20 days with Overbought/Oversold levels at 100/-100. To alter the default settings - Edit Indicator Settings.
See Indicator Panel for directions on how to set up an indicator.
Commodity Channel Index Formula
The Commodity Channel Index calculation is fairly complicated. Here is the formula for 20-day CCI:
- Calculate Typical Price ("TP"):
(High + Low + Close) / 3 - Calculate TPMA: a 20-day simple MA of TP.
- Subtract TPMA from TP
- Divide the result by the following:
- Subtract today's TPMA from TP for each of the last 20 days.
- Sum the absolute values and divide by 20.
- Multiply the result by 0.015.
Any other time period (e.g. 10 days or 30 days) can be substituted for 20.

Author: Colin Twiggs is a former investment banker with almost 40 years of experience in financial markets. He co-founded Incredible Charts and writes the popular Trading Diary and Patient Investor newsletters.
Using a top-down approach, Colin identifies key macro trends in the global economy before evaluating selected opportunities using a combination of fundamental and technical analysis.
Focusing on interest rates and financial market liquidity as primary drivers of the economic cycle, he warned of the 2008/2009 and 2020 bear markets well ahead of actual events.
He founded PVT Capital (AFSL No. 546090) in May 2023, which offers investment strategy and advice to wholesale clients.
