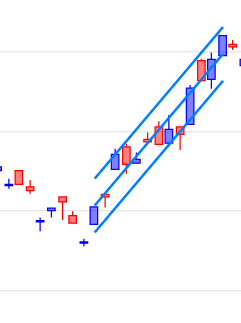
Trendlines & Captions in the Browser
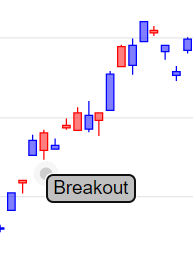
Add Text
- Select the Textbox icon
on the Draw toolbar
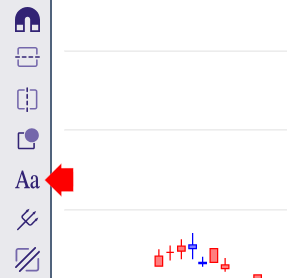
- Change your settings as desired.

- Click on the chart to place the text.
- Enter text in the box.
Draw a Trendline
To draw a trendline:
- Select the Autofit Trendline
icon on the Draw toolbar.
- Select Closing Price for long-term charts or Highs/Lows (HiLo) for short-term (less than 6 months).

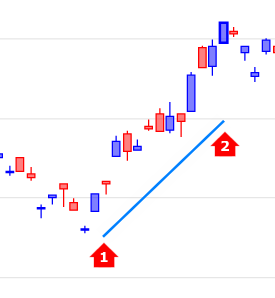
- Click and Drag your mouse from 1 to 2 below (up-trend) or above (down-trend) the price bars for the period
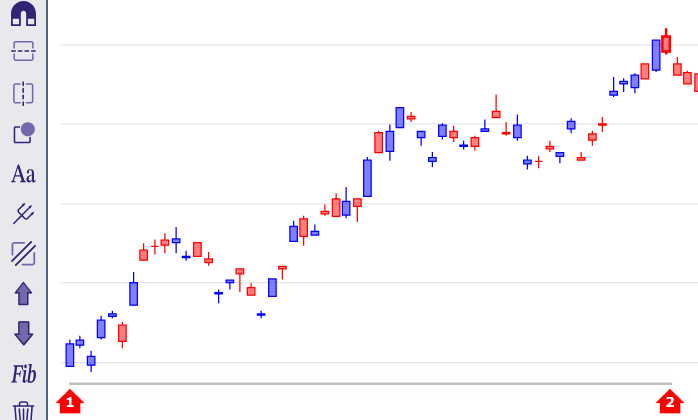
- The trendline will automatically fit to price bars in the selected time period
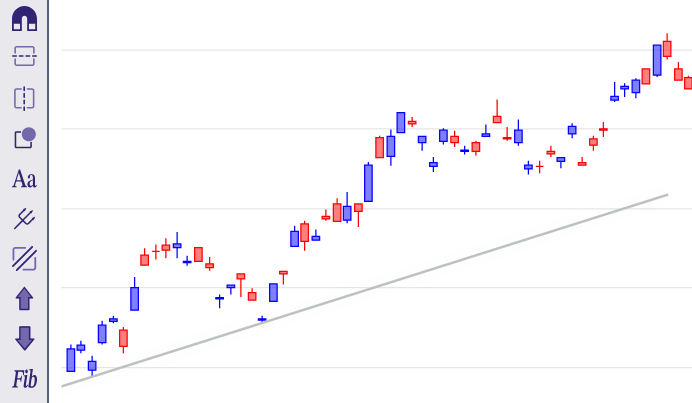
To modify a trendline:
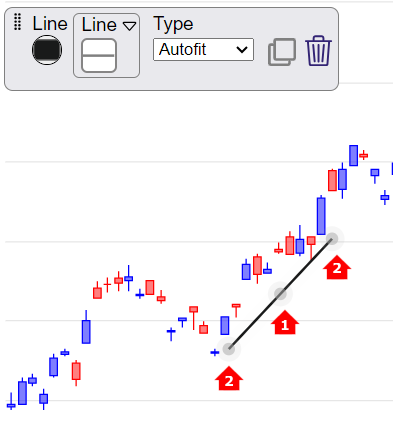
- Left-click on the trendline to edit its properties.
- Select the centre anchor (1) on the trendline to drag it to a new position.
- Click on the anchor at either end (2) to drag that end only.
Draw a Standard Deviation Channel
This fits a linear regression line to selected data, with channel lines normally at 2 standard deviations on either side (enclosing roughly 95% of the data).
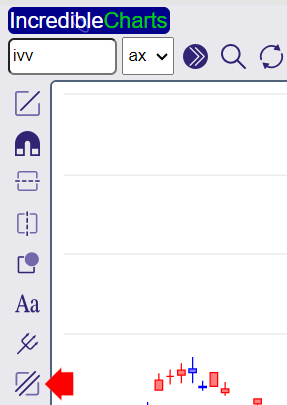
- Select the Channels
icon on the Draw toolbar
- Select the number of standard deviations (normally 2.0).

- Click on the chart and drag from (1) to (2) across the selected time period
The standard deviation channel will then appear on the chart.
