Get Started with Incredible Charts in your Browser

Register for the Free Version
Incredible Charts offers free charting with access to most features. Data calls are limited to 100 per month and stock screens are a premium feature.
To access the free service:
- Sign up as a free member below.
- Or, login here.
- Bookmark the login link in your browser.
Upgrade to Premium
Upgrade to the Premium Service for unlimited data calls and stock screens.
Click below for a 30-day Free Trial.
Top Menu
Please note these four tools in the top menu:
Create a project and add indicators
Create a watchlist and add stocks
Compare performance of several symbols
Create a stock screen and add filters
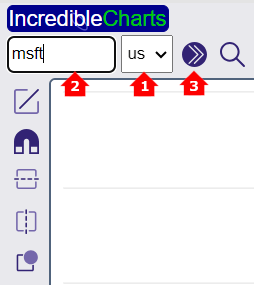
Select a Stock or Index

- Select an Exchange on the toolbar
- Enter the security symbol
- Submit (3) or hit the Enter key.
To Search for a stock, select on the toolbar.

Select an Exchange and then one of three options:
- Symbol starts with
- Name starts with
- Name contains
Select a Chart
Use the toolbar to select the chart type, chart interval and price scale.

There are four basic Chart Types:
- Candlestick
- Heikin-Ashi Candlesticks
- OHLC displays bar charts with Open High Low and Close
- Line displays only closing price
Chart Interval sets the period represented by each bar, with options from 1-minute to Annual. Daily and Weekly are the most popular intervals.
To change the Price Axis to Logarithmic Scale, select the Log button on the toolbar.
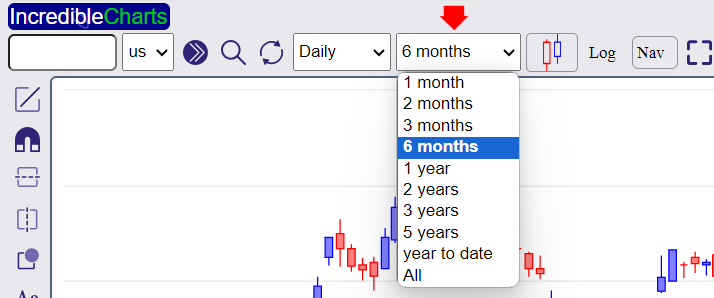
Change the Time Period
Select a Time Period for the chart from the drop-down box on the toolbar.

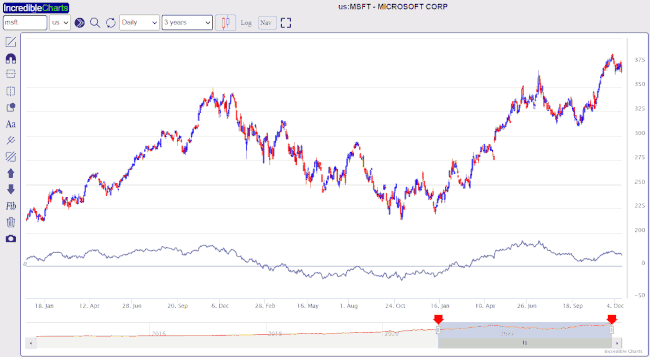
Navigation Bar
The Navigation Bar below the chart can be hidden or displayed by clicking ![]() on the toolbar.
on the toolbar.
Click and drag the handles on the Navigation Bar to alter the chart time period as shown below.

