Indicators & Overlays in the Browser
Create an Indicator Project
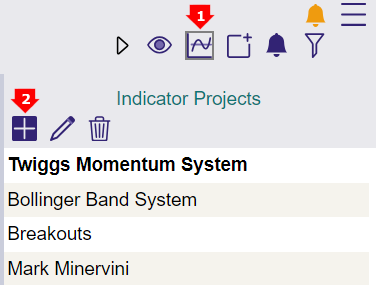
- Select
on the top (right) toolbar. This will display a list of saved indicator projects.
- Select
on the Indicator Projects toolbar to create a new project.
Select an Indicator Project
- Select
on the top (right) toolbar. This will display a list of saved indicator projects.
- Select a project (eg. Twiggs Momentum System).
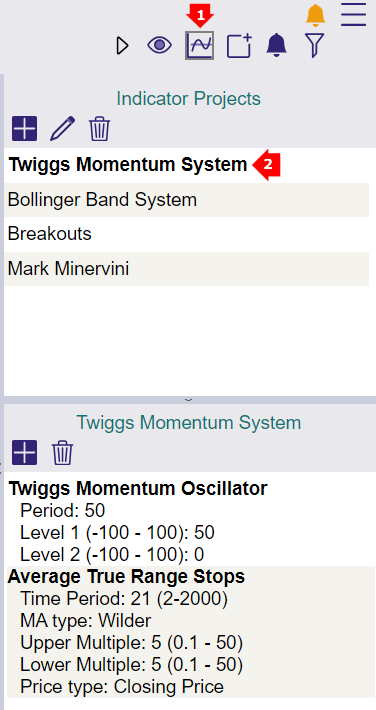
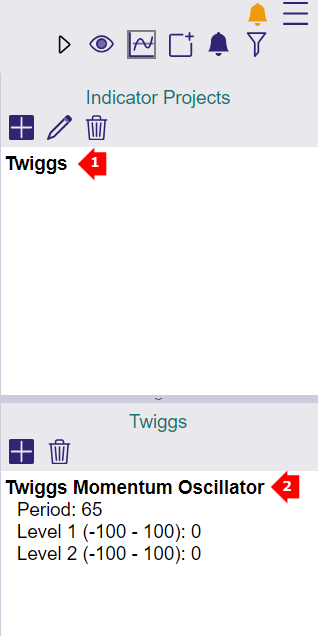
The selected project will display in the lower half of the right column (below the Indicator Projects).
Add an Indicator
- Create a new Indicator Project or select one as shown above.
- To add an indicator click the
in the Project toolbar as shown below.
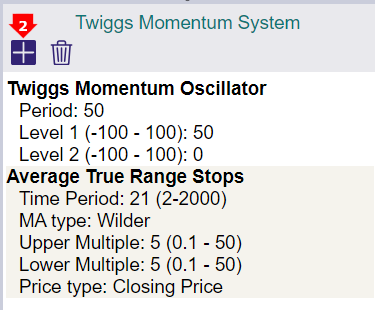
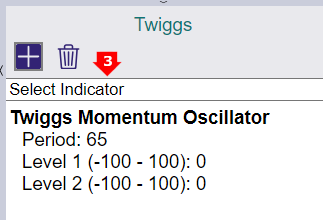
- Select an indicator from the drop-down box.
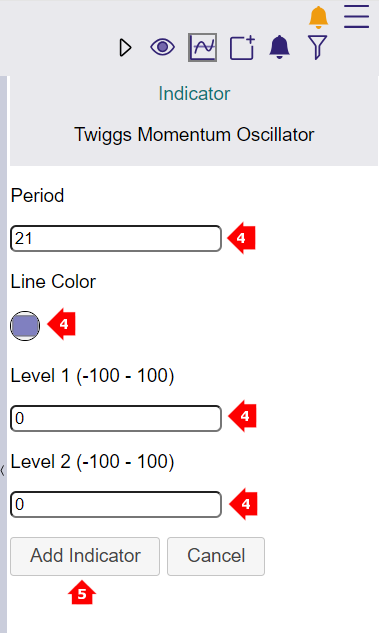
- Enter your desired settings and choose a Line Color.
- Click the Add Indicator button to Save.
The saved indicator will then appear in your project.
Edit an Indicator
- Select an Indicator Project as explained above.
- Select an Indicator from the project in the lower half of the right-column.
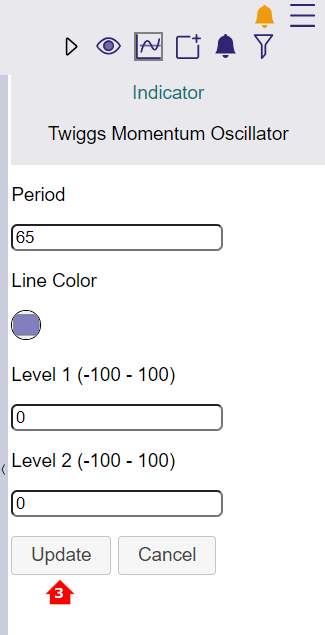
- Adjust the Indicator settings and click Update to Save.
Delete an Indicator or Project
Delete a Project
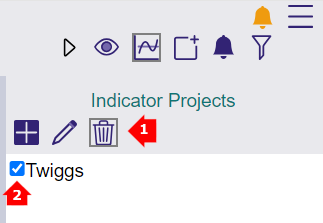
- Select the
on the Indicator Projects toolbar. Check Boxes will then appear next to each project.
- De-select the Project you would like to delete.
Delete an Indicator
- Select a Project.
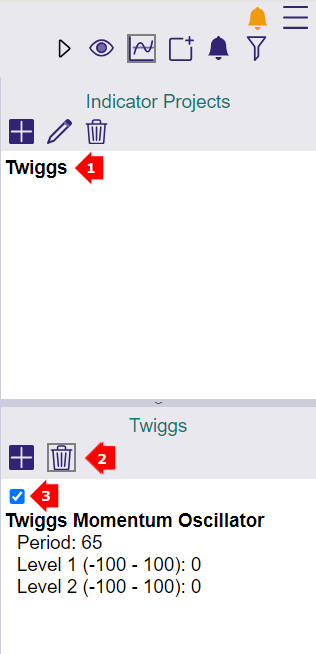
- Select the
on the project toolbar. Check Boxes will then appear next to each indicator.
- De-select the Indicator you would like to delete.
Overlays
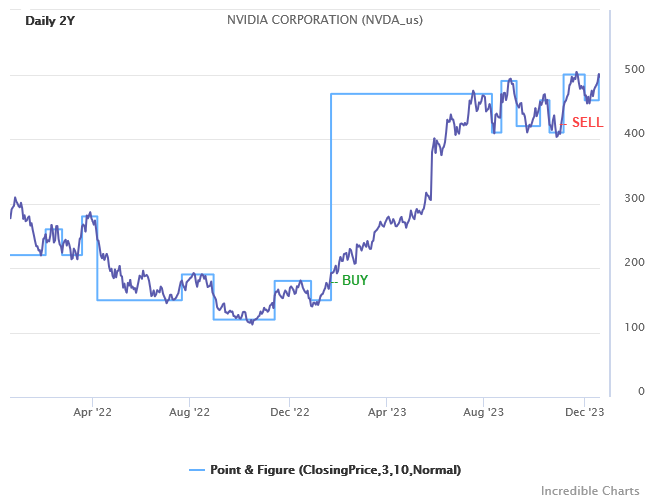
Overlays for Darvas Boxes, Kagi and Point & Figure are useful in identifying trend changes. They can be selected from the drop-down list of indicators.
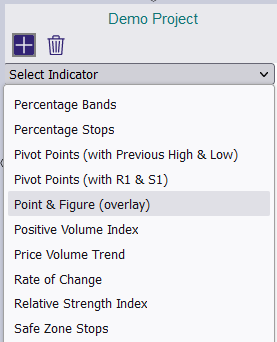
The overlay will be displayed on the normal price chart as shown below.
