Get Started with Incredible Charts
Premium Service
Incredible Charts offers a Premium Service with regular updates, premium indicators, stock screen filters and no ads.
A 30-day Free Trial of the Premium Service will automatically activate when you install & register the Incredible Charts software for the first time.
Select a Stock or Index
Data is fetched directly from our online database when you select a stock symbol.

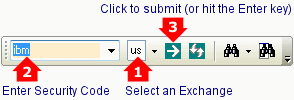
- Select an Exchange on the toolbar
- Enter the security symbol
- Click
 Load Security or hit the Enter key.
To find a stock, use Search on the Securities menu, the toolbar ![]() or shortcut key F3.
or shortcut key F3.
Select a Chart
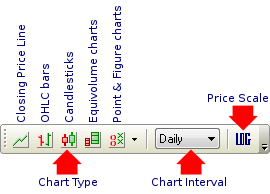
You can use the toolbar below, or the View menu, to select chart type, chart interval and price scale.

The chart type sets the line or bar presentation. There are five basic chart types:
 Close plots a single line representing closing price
 OHLC uses bar charts with Open High Low and Close to reflect price performance
 Candlesticks highlight the relationship between opening and closing prices
 Equivolume combines price and volume information to confirm price movements
 Point And Figure focuses on price movements to identify support, resistance & chart patterns
See Chart Types for further details.
The chart interval sets the period covered by each bar. Intervals range from 1-minute to Annual, with Daily and Weekly the most frequently used bars. See Chart Intervals for further details.
Logarithmic Price Axis on the View menu or toolbar (below) sets the price axis to Logarithmic or Normal Scale.
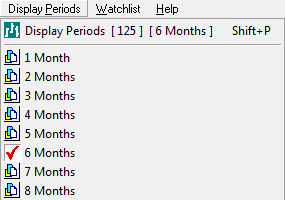
Change the Time Frame
To change the chart time frame, select Display Period on the main menu.

