Reference guide of technical indicators, listed in alphabetical order:
What are Technical Indicators?
Technical indicators highlight a particular aspect of price or volume behavior on a stock chart to provide valuable insights and help with analysis. They provide entry and exit signals in stock trading systems and identify suitable trading opportunities with Stock Screens. This helps to minimize psychological pressure during decision-making.
How to Use Technical Indicators Helps guide you to select suitable technical indicators and to understand their strengths and weaknesses.
Always be on the lookout for price respecting a moving average, divergences between price action and momentum oscillators, and failure swings. These often give early warning of an impending change.
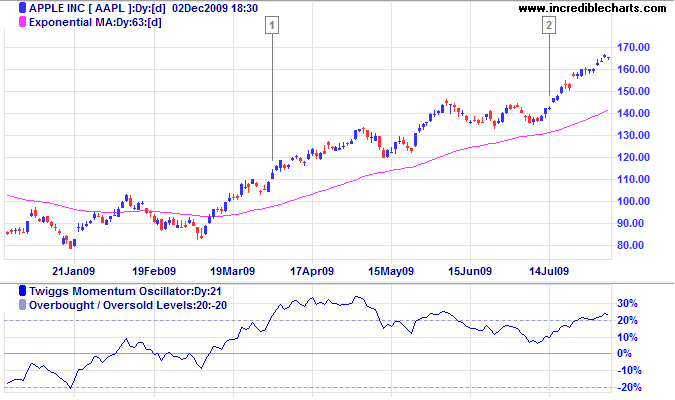
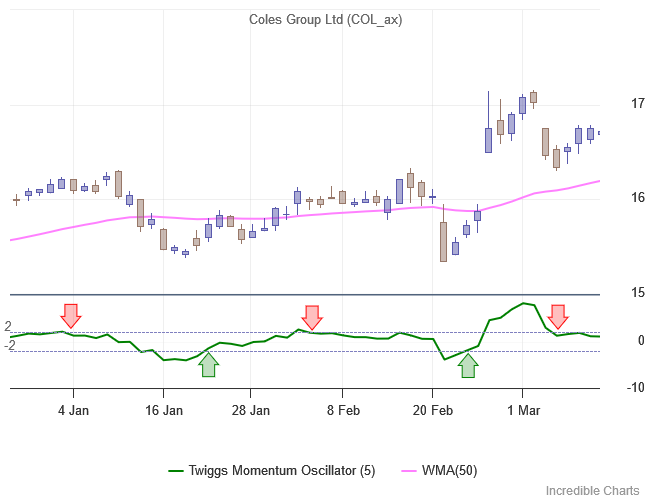
Twiggs Momentum Oscillator is a new momentum indicator developed for Incredible Charts. A smoothed version of the Rate Of Change oscillator, its primary purpose is to identify fast trending stocks using the stock screener.
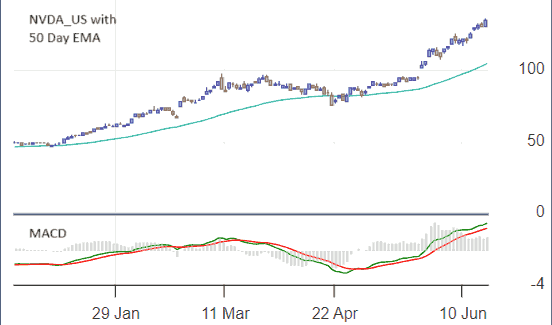
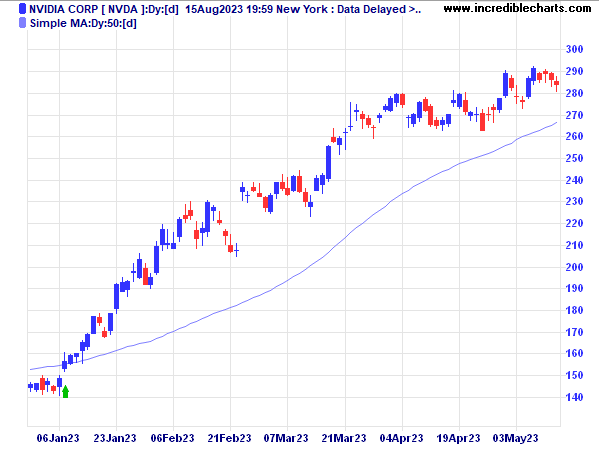
Moving averages provide an objective measure of trend direction by smoothing price data. Normally calculated using closing prices, moving averages (MAs) can also be used with median, typical , weighted closing, and high, low or open prices as well as other indicators.
Momentum Indicators measure the rate of change in price. They are used to measure the fluctuation between overbought and oversold levels but have three basic weaknesses.
Along with volume, volatility can be used to confirm price behavior. Expanding and contracting ranges highlight the strength of breakouts and trends. Lack of confirmation may warn of a reversal.
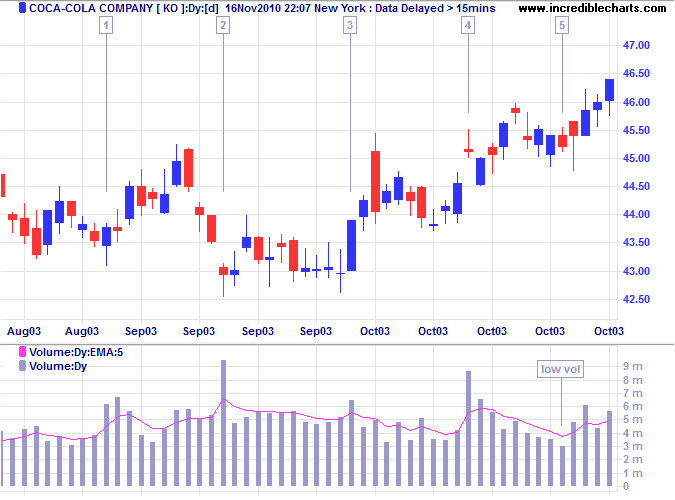
Volume indicators are used to confirm the strength of trends. Lack of confirmation may warn of a reversal. Some of the more sophisticated indicators compare volume and price movements.
Accumulation Distribution The Accumulation Distribution Indicator tracks the relationship between price and volume, acting as a leading indicator of price movements.
Aroon Oscillator The Aroon Oscillator was developed by Tushar Chande to identify the start of a new trend and measure trend strength.
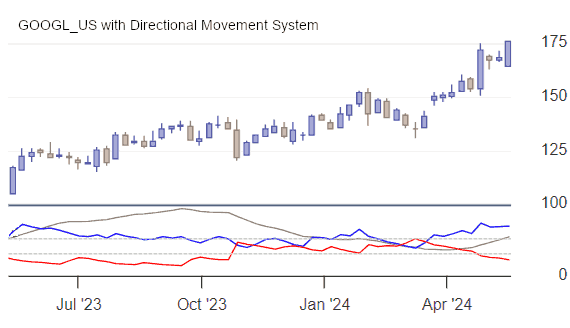
Average Directional Index (ADX) ADX is part of the Directional Movement System developed by J. Welles Wilder. It is used to warn of trend changes and to identify whether a stock is trending or ranging.
Average True Range Average True Range are used to measure commitment. Expanding ranges signal increased eagerness and contracting ranges, a loss of enthusiasm.
Average True Range (ATR) Bands ATR Bands are used to signal exits in a similar fashion to ATR Trailing stops, but without the stop-and-reverse (SAR) of trailing stops.
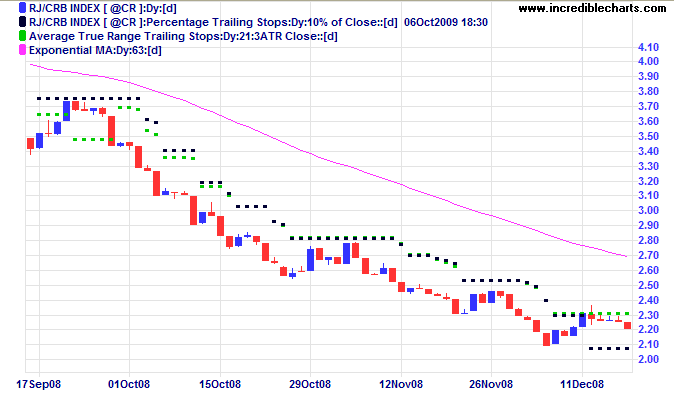
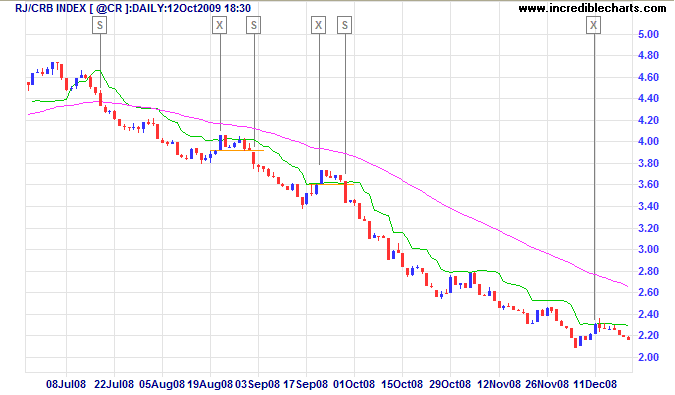
Average True Range (ATR) Trailing Stops ATR Trailing Stops are primarily used to protect capital and lock in profits on individual trades but they can also be used, in conjunction with a trend filter, to signal entries.
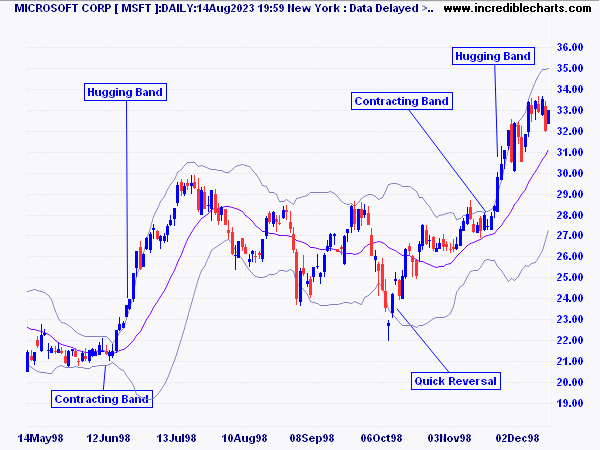
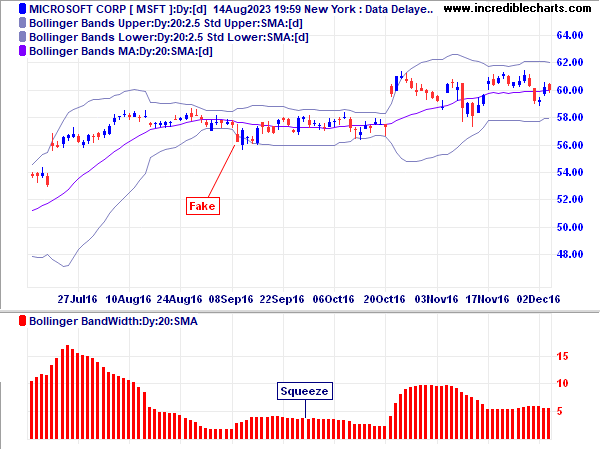
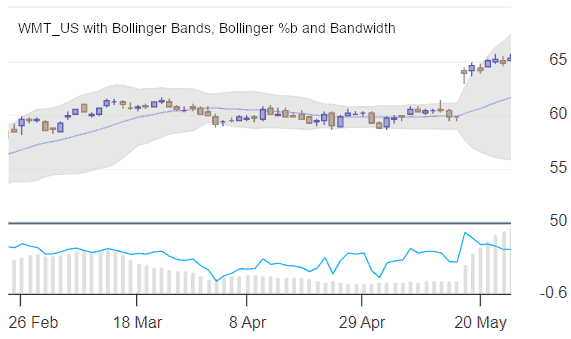
Bollinger Bands Bollinger Bands are used to confirm trading signals by indicating overbought and oversold levels relative to a moving average. Includes two great trading strategies: Squeezes and Trends.
Bollinger Bandwidth Bollinger's Bandwidth Indicator is used to warn of changes in volatility. A squeeze, where the bands converge into a narrow neck, often precedes a sharp price rise or fall.
Bollinger Percentage B Bollinger %b is used to signal subtle entry and exit opportunities that may be overlooked in a trend.
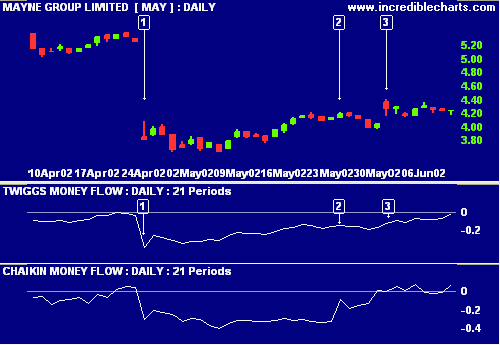
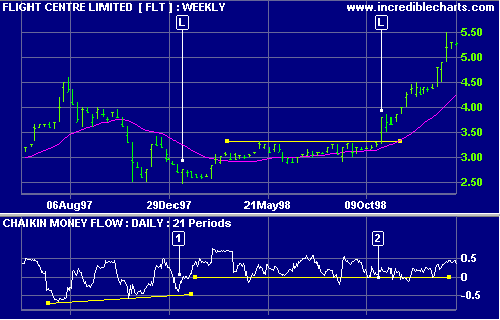
Chaikin Money Flow Chaikin Money Flow is based on the observation that buying support is normally signaled by increased volume and frequent closes in the top half of the daily range.
Chaikin Oscillator The Chaikin Oscillator compares money flow to price action in order to help identify tops and bottoms in short and intermediate cycles.
Chaikin Volatility Chaikin measures volatility as the trading range between the high and low for each period. Look for sharp increases in volatility prior to market tops and bottoms, followed by low volatility as the market loses interest.
Chande Momentum Oscillator Chande Momentum Oscillator uses Overbought and Oversold levels, as well as Divergences, to identify reversals.
Chandelier Exits Chandelier Exits are primarily used as a stop loss mechanism to time exits from a trending market.
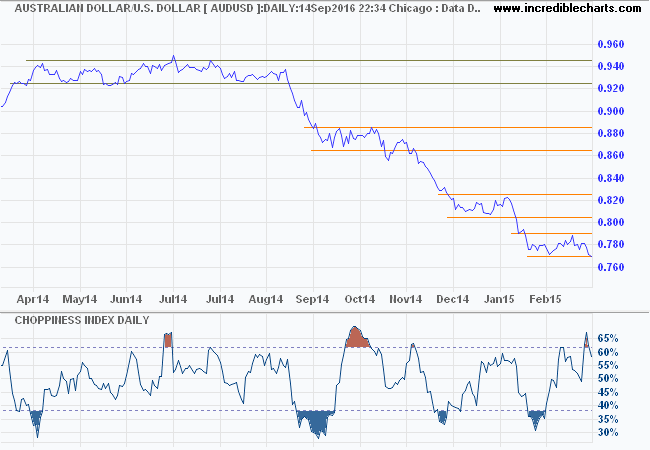
Choppiness Index The Choppiness Index is a volatility indicator developed by Australian commodity trader Bill Dreiss to indicate whether a market is trending or ranging.
Commodity Channel Index The Commodity Channel Index (CCI) measures the position of price in relation to its moving average. This highlights overbought and oversold markets and likely turning points.
Detrended Price Oscillator The Detrended Price Oscillator isolates the short cycle, providing powerful trend signals on divergences.
Directional Movement Index The Directional Movement Index (DMI) measures the ability of bulls and bears to move price outside of the previous day's trading range. It is one of few indicators that first identifies whether the market is trending before providing signals for trading the trend.
Donchian Channels Richard Donchian's Channels are used in a number of trading systems to identify entry and exit points in trends.
Ease of Movement The Ease of Movement indicator highlights the relationship between volume and price changes and is particulary useful for assessing the strength of a trend.
Elder Ray Index Developed by Dr Alexander Elder, the Elder-Ray indicator measures buying and selling pressure in the market and is often used as part of the Triple Screen trading system.
Force Index Developed by Dr Alexander Elder, the Force index combines price movements and volume to measure the strength of bulls and bears in the market.
Linear Regression Indicator The Linear Regression Indicator is used for trend identification and trend following in a similar fashion to moving averages, but reacts faster than an MA to trend changes..
MA Oscillator The Moving Average Oscillator simply compares closing price to the moving average.
MACD Trading large swings and divergences in the MACD indicator provides more reliable signals than alternate oscillators.
MACD Histogram The MACD Histogram (Moving Average Convergence Divergence Histogram) provides far earlier and more responsive signals than the original MACD, but is also more volatile.
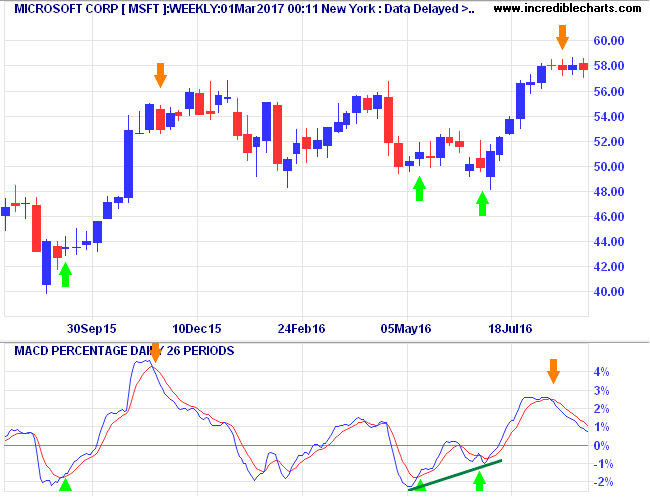
MACD Percentage Price Oscillator MACD Percentage Price Oscillator is a variation of the MACD indicator. The major difference is the percentage scale which enables comparison between stocks.
Mass Index The Mass Index Indicator attempts to predict trend reversals by comparing the trading range for each period.
Median Price Median price measures the mid-point of the trading range for each period.
Momentum Indicator Momentum measures trend strength and identifies likely reversal points: on divergences or when Momentum crosses the overbought/oversold line.
Money Flow Index The Money Flow Index is a volume-weighted version of the Relative Strength Index, used to warn of trend weakness and likely reversal points.
Moving Averages (MA) The Moving Average smooths price data to create a powerful measure of trend direction. Simple, weighted and exponential moving averages are most popular.
Moving Average Systems Crossovers of fast and slow moving averages are particularly useful for identifying trends and make an effective trading system when combined with stop losses.
Negative Volume Index Negative Volume Index is based on days when volume is down from the previous day. Norman Fosback uses Negative Volume Index (NVI) with Positive Volume Index (PVI) to identify bull markets.
On Balance Volume Developed by Joseph Granville, OBV provides a powerful measure of accumulation and distribution by comparing volume to price movements.
Parabolic SAR Developed by J. Welles Wilder, the Parabolic SAR indicator provides excellent short/medium-term entry and exit points in trending markets.
Percentage Bands A simple trend-following system that plots bands at a set precentage above and below closing price, with a ratchet mechanism to prevent the lower band from falling during a long trade and the upper band from rising during a short trade.
Percentage Trailing Stops Percentage Trailing Stops are a simple but effective method for locking in profits.
Pivot Points Pivot Points are used for calculating support and resistance for short-term trading.
Positive Volume Index (PVI) Introduced by Norman Fosback, Positive Volume Index identifies bull and bear markets by measuring activity on days when volume is higher.
Price Differential Similar to Price Comaprison, you can compare bond yields or interest rates that share the same price axis.
Price Envelope Sometimes referred to as Percentage Bands, Price Envelopes are plotted at a set percentage above and below a moving average.
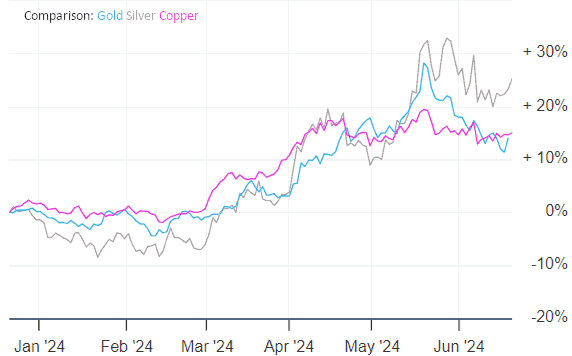
Price Ratio A powerful tool for stock selection, Price Ratio is also referred to as Relative Strength and compares the performance of a stock relative to an index or a related stock.
Price Volume Trend The Price Volume Trend indicator measures the strength of trends and warns of reversals.
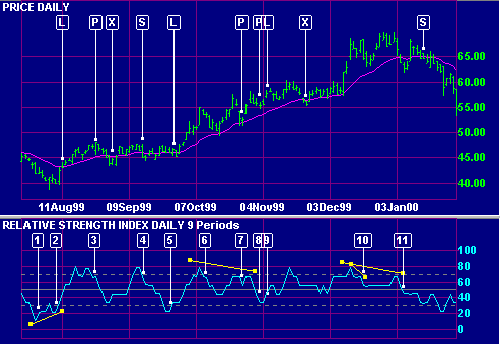
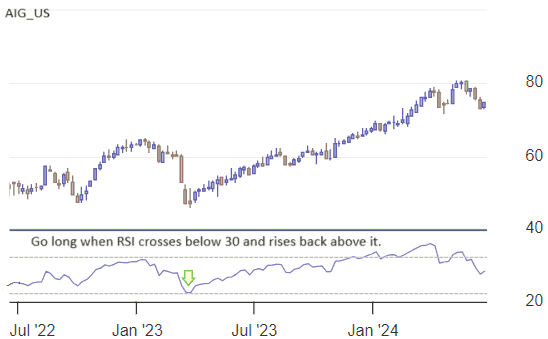
Relative Strength Index (RSI) Developed by Welles Wilder, RSI (Relative Strength Index) is a popular momentum oscillator that compares upward and downward movements in closing price.
Safezone Alexander Elder's Safezone Stops use Directional Movement to signal exits from a trend.
Slow Stochastic The Slow Stochastic Oscillator provides more reliable signals than the original indicator, applying further smoothing to reduce volatility and improve accuracy.
Smoothed Rate of Change (SROC) Smoothed Rate of Change (SROC), introduced by Fred G Schutzman in 1991, gives slower but more accurate signals than other momentum oscillators.
Standard Deviation Channels Standard deviation channels, plotted at a set number of standard deviations around a linear regression line, provide useful entry and exit signals for trading trends.
Stochastic Oscillator The Stochastic Oscillator tracks market momentum and provides excellent entry and exit signals from crossover of %K and %D lines or overbought/oversold levels.
Stochastic RSI Stochastic RSI was designed by Tushar Chande and Stanley Kroll to generate more Overbought and Oversold signals than Welles Wilder's original Relative Strength oscillator.
Trendlines The trend line is a powerful momentum indicator, alerting you to any acceleration or deceleration of the trend.
TRIX Designed for trading trends, TRIX uses a triple-smoothed moving average to eliminate cycles shorter than the indicator period.
True Range Welles Wilder's True Range adjusts the normal High - Low daily range when there is an opening gap.
Twiggs ® Momentum Oscillator Twiggs® Momentum Oscillator is a smoothed version of the Rate Of Change oscillator. Its primary purpose is to identify fast trending stocks.
Twiggs ® Money Flow Twiggs® Money Flow is a derivation of the Chaikin Money Flow indicator. Position above/below the zero line gives advance indication of breakouts, while divergences warn of reversals.
Twiggs ® Smoothed Momentum Twiggs® Smoothed Momentum is a smoothed version of the proprietary Twiggs® Momentum oscillator. Its purpose is to provide a slower, less erratic signal for following long-term trends.
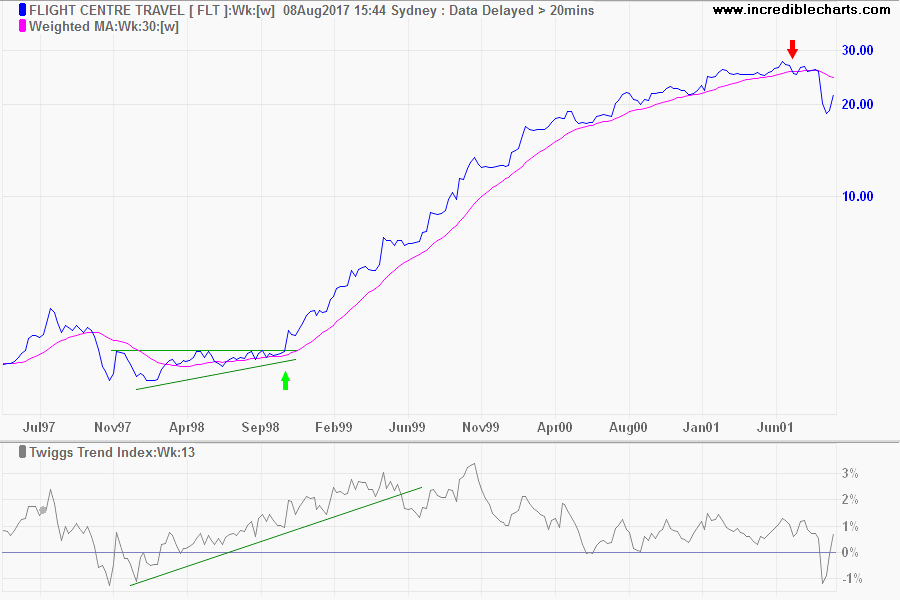
Twiggs ® Trend Index Twiggs® Trend Index is a variation of the popular Twiggs® Money Flow indicator, calculated using Volatility instead of Volume, which offers two distinct advantages.
Twiggs ® Volatility Twiggs® Volatility is a proprietary volatility indicator used to flag elevated market risk.
Typical Price Typical price, calculated as (High Low Close) / 3, is a useful filter for moving average systems.
Weighted Close Weighted Close, calculated as (High Low Close * 2 ) / 4, is a simple but effective filter for moving average systems.
Williams Percent R Williams %R is similar to Stochastic %K. Entry signals are taken on divergences, failure swings or crossover of the overbought/oversold level.
Williams Accumulate Distribute Larry Williams highlights accumulation and distribution by comparing daily trading ranges. Signals are taken on divergences.
Williams Accumulation Distribution Williams Accumulation Distribution is traded on divergences. When price makes a new high and the indicator fails to exceed its previous high, distribution is taking place.