Price and Volume Trend
Price and Volume Trend (PVT) is a variation of On Balance Volume, used to determine the strength of trends and warn of reversals.
PVT Trading Signals
Trading signals are the same as for OBV and Accumulation Distribution.
Price and Volume Trend should not be used on its own but in conjunction with other indicators.
Ranging Market
During a ranging market watch for a rising or falling Price and Volume Trend.
- Rising PVT signals an upward breakout.
- Falling PVT signals a downward breakout.
Trending Market
A rising Price and Volume Trend confirms an up-trend and a falling PVT confirms a down-trend.
- Bullish divergence between PVT and price warns of market bottoms.
- Bearish divergence between PVT and price warns of market tops.
Example
Australia and New Zealand Banking Group Limited (ANZ) is shown with Price Volume Trend.
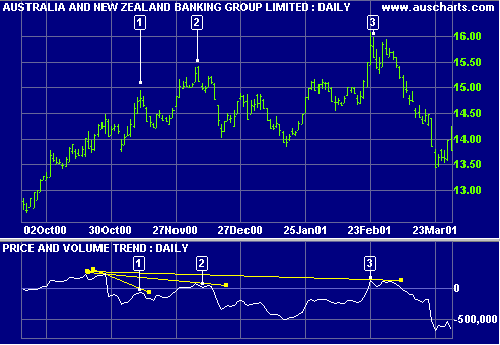
Mouse over chart captions to display trading signals.
- After a strong up-trend there is a bearish divergence with price making a new high and Price and Volume Trend making a lower high.
- This is followed by a triple divergence: price makes a higher peak while PVT is lower.
- Price makes another new high at the end of February while PVT again fails to make a new high. Note the classic divergence.
Setup
See Indicator Panel for directions on how to set up Price and Volume Trend. Edit Indicator Settings to alter the default settings.
Price and Volume Trend Formula
The steps in the Price and Volume Trend calculation are:
- Calculate the Percentage Change in closing price:
( Closing Price [today] - Closing Price [yesterday] ) / Closing Price [yesterday] - Multiply the Percentage Change by Volume:
Percentage Change * Volume [today] - Add to yesterday's cumulative total:
Percentage Change * Volume [today] + PVT [yesterday]

Author: Colin Twiggs is a former investment banker with almost 40 years of experience in financial markets. He co-founded Incredible Charts and writes the popular Trading Diary and Patient Investor newsletters.
Using a top-down approach, Colin identifies key macro trends in the global economy before evaluating selected opportunities using a combination of fundamental and technical analysis.
Focusing on interest rates and financial market liquidity as primary drivers of the economic cycle, he warned of the 2008/2009 and 2020 bear markets well ahead of actual events.
He founded PVT Capital (AFSL No. 546090) in May 2023, which offers investment strategy and advice to wholesale clients.